Sign in. It’s quick, free and it’s up to you.
An account is an optional way to support the work we do. Find out more.
Sign in. It’s quick, free and it’s up to you.
An account is an optional way to support the work we do. Find out more.

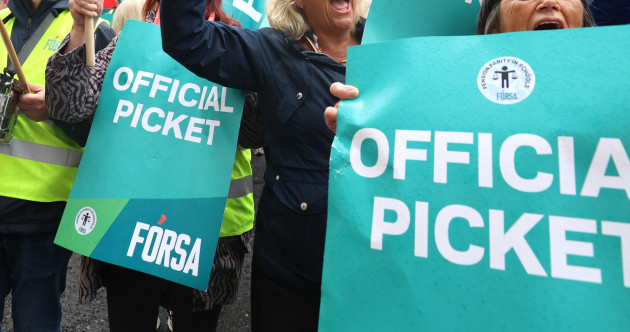
TODAY’S PUBLIC SERVICE strike has dominated the political agenda this week, and unions and the government have spent the last few days drawing their respective battle lines.
The strike, which will involve around 300,000 workers, has been called over the failure to agree a new public sector pay deal after the most recent agreement expired in June.
Unions say that public service workers’ pay has fallen behind inflation, and they want increases that restore and protect the purchasing power of their members.
The government has invited unions to talks, but unions have rejected the offer because, they say, there were no new proposals addressing their concerns.
Fórsa General Secretary Kevin Callinan told RTÉ radio at the weekend that workers were “struggling to make ends meet” and that their recent pay increases have fallen behind inflation.
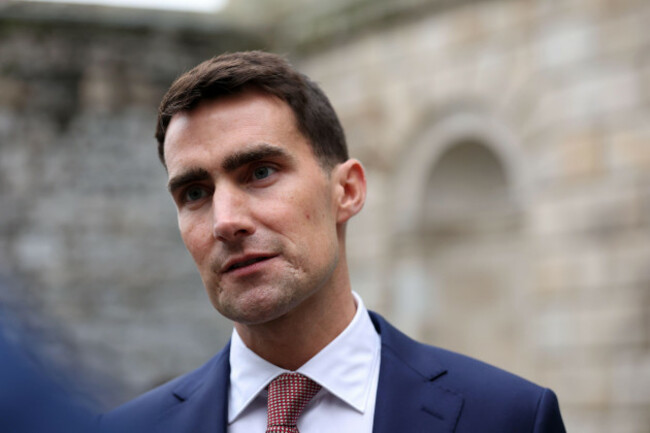
However, public expenditure minister Jack Chambers has claimed that incomes for public service workers in recent years have outstripped inflation.
Who is right?
Fórsa’s Kevin Callinan has said that the average public servant’s pay is around 5% behind price increases for the five years up to last year.
Speaking to Áine Kerr on RTÉ’s Today programme on Saturday, he said: “The average public servant is at least 5% behind prices for the five years from 2021 through to 2025.”
Public expenditure minister Jack Chambers appeared to claim the opposite when speaking to The Sunday Times.
He said that recent pay deals agreed between the government and public sector unions have “protected incomes for public service workers above increases in inflation in recent years”, and that those on the lowest incomes have been “best protected”.
Chambers wasn’t necessarily responding to Callinan’s specific claim on RTÉ; however, both appear to be coming at the debate from different sides.
The Department of Public Expenditure and Reform clarified that the minister’s reference to “incomes” meant gross basic salary rates.
Its response pointed to general increases of 9.6% under the January 2024 to June 2026 public sector pay agreement, compared with inflation of 6.6%.
The response also offered a longer-term comparison: headline salary increases of 22.5%, including sectoral bargaining, from 2019 to 2025 were compared to annual-average inflation of 23.2%.
And it said that an additional 1% local bargaining increase, if applied, would bring the compounded pay increase to 23.8%.
Fórsa responded to The Journal’s queries about Callinan’s by referring us to an economist, Ciarán Nugent of the Nevin Economic Research Institute (NERI).
The claims concern different periods and measures; in separate responses, Chambers referred to negotiated basic salary rates, while Callinan referred to the “average public servant”.
Part of the difficulty with a claim like this is that public service workers include civil servants, teachers, nurses, gardaí, local authority employees, doctors, dentists and many other groups.
Salary increases differ across grades, while measured average earnings can also change because of increments, overtime and the mix of employees.
Simply averaging the percentage increases for different grades would not establish the increase received by the average worker. That calculation would need to account for how many workers were on each salary point and which increases applied to them.
The CSO publishes measured average earnings, but these can also change because of increments, overtime and changes in the mix of employees.
They therefore measure something different from the increases in basic salary rates negotiated under pay agreements.
Because of this, both Chambers and Callinan can make claims that suit their side of the argument, and both are right in the specific points they make in this case.
However, there is a lot more nuance to the argument.
Ciarán Nugent of NERI said the CSO’s quarterly Earnings, Hours and Employment Costs Survey provides average earnings figures.
“We’re reliant on these averages,” he said, explaining that they can conceal differences between workers.
His latest report, Public v Private sector wages 2008–2026, examines those earnings over a longer period.
It provides context, but does not directly test Callinan’s specific claim about 2021–2025.
With all of that in mind, let’s look at the pay increases that public servants have received in recent years.
Since 2018, there have been three national agreements between public sector unions and the government:
Each of these agreements increased basic salary rates at certain intervals, though some instalments were an either/or that contained a guaranteed minimum euro amount for lower-paid workers, to give them a larger proportional rise if the cash amount was higher.
For example, a worker on a salary of €30,000 may have been offered the higher amount between a rise of 1% – equivalent to €300 – or €500.
Under the first of the three agreements, The Public Service Stability Agreement:
The second agreement, Building Momentum, provided for another series of increases:
The deal also provided a sectoral bargaining fund equivalent to 1% of basic pay, which could be used for particular measures or a general increase. In the civil service, this was applied as a 1% increase across grades from February 2022.
The agreement was subsequently revised and extended to the end of 2023:
The final and most recent agreement, the Public Service Agreement, covered seven increases over three years:
There were a lot of increases over eight years, so it can be hard to envisage what exactly they translate to.
But there are specific levels in the public service that can help illustrate the cumulative changes between 2018 and June 2026.
These salary examples begin after the January 2018 increase; the agreement-wide calculations below include that award.
The starting salary for a clerical officer rose from €23,107 in January 2018 to €31,921 in June 2026 – an increase of around 38%.
Over the same period, the starting rate for an executive officer increased from €29,026 to €38,803, or approximately 34%.
Further up the pay scales, the starting salary for a principal officer rose from €84,973 to €108,152, an increase of around 27%.
At the most senior level, the published salary for a Level I secretary general rose from €192,233 to €283,711 – an increase of approximately 48%, although this also includes pay restoration beyond the general increases outlined above.
These comparisons track changes to the same point on each pay scale.
Individual workers may have received increases through increments or promotion, while changes to published scales can include adjustments specific to particular grades.
Chambers’s office also highlighted lower-paid grades.
For example, the clerical officer starting rate increased by approximately 14.5% over the latest agreement, compared with general percentage awards of 9.6% and inflation of 6.6%.
The cash minimums therefore provided greater proportional protection at the lower end of different scales.
What about inflation over the same time period?
Of course, salaries weren’t the only things going up during that time.
Economies experience inflation at the best of times, but a series of global crises and their knock-on effects have also seen the cost of living jump in recent years.
The sharpest price rises came in 2022 and 2023, driven by disruption to supply chains and a rebound in demand following the Covid pandemic, alongside surging energy and food costs following Russia’s invasion of Ukraine.
According to the CSO, annual-average inflation was 0.5% in 2018, 0.9% in 2019, while prices fell by 0.3% on an annual-average basis in 2020.
Annual-average inflation was then 2.4% in 2021, 7.8% in 2022 and 6.3% in 2023. It then slowed to 2.1% in 2024 and 2.2% in 2025.
For a cumulative comparison, the relevant question is how much prices increased between the same starting and ending points used to measure pay.
To give some more illustrative examples of inflation, CSO figures show that the national average price of two litres of full-fat milk rose from €1.70 in January 2018 to €2.38 in June 2026 – an increase of around 40%.
Meanwhile, a pound of butter rose from approximately €3.01 to €4.29, or around 43%, while an 800g white sliced pan increased from €1.27 to €1.67, or approximately 32%.
These illustrate changes in selected everyday products; the overall CPI measures a much broader basket of goods and services.
But together, these products give a rough idea of how much more consumers are now paying compared to eight years ago.
So did each pay agreement beat inflation?
During the period that the first agreement was in place from 2018 to 2020, the four general increases – 1% in January 2018, 1% that October, 1.75% in September 2019 and 2% in October 2020 – compounded to approximately 5.9%.
Additional increases applied to salaries that were below specified thresholds, while some workers also received pay restoration.
Over the same period, CSO figures show that prices increased by approximately 1% (comparing December 2017, just before the agreement began, with December 2020).
When the next agreement, Building Momentum and its extension, were in place from the end of 2020 to the end of 2023, the general percentage awards compounded to approximately 8.8%.
Again, some workers benefited from minimum cash increases and got larger proportional rises, and there was sectoral bargaining and pay restoration for particular groups.
CSO figures show that prices increased by approximately 19.4% over those three years.
And finally, between January 2024 and June 2026, when the most recent agreement was in place, the seven general percentage increases compounded to approximately 9.6%.
There was yet again some minimum cash increases for lower-paid workers, with additional changes through local bargaining.
Prices increased by approximately 6.6% between December 2023 and June 2026, the period covering that final agreement.
In other words, these comparisons show that the general percentage awards exceeded inflation during periods when the first and last pay deals were in place, but fell substantially short during the intervening surge in prices.
Chambers’s claim is therefore supported for the latest agreement: general salary increases exceeded inflation between December 2023 and June 2026, while minimum cash increases gave lower-paid workers greater proportional protection.
But the picture is different when you take all three pay agreements together.
Between January 2018 and June 2026, the percentage awards outlined in the three agreements compounded to a rise of 26.2%.
This does not account for minimum cash increases, additional awards or pay restoration, so it does not capture the full increase received by every worker.
But the figure compares with a 28.6% increase in prices between December 2017 and June 2026.
It’s crucial to note that the comparisons do not, by themselves, show the average increase across the public service.
Chambers’s longer comparison uses a different period and method: his office’s inflation figure of approximately 23.2% compares average prices in 2018 and 2025, while its pay calculation compounds increases taking effect during 2019 to 2025.
Annual averages are a valid measure of inflation, but comparing them with endpoint salary increases does not put both sides on the same basis.
Comparing December 2018 with December 2025 instead gives inflation of approximately 24.8%, above both the 22.5% headline pay increase and the 23.8% figure including an assumed 1% local increase.
That additional local bargaining allocation also did not necessarily translate into a 1% salary increase for every worker.
Lower-paid workers could nevertheless have received larger increases through the cash minimums.
Neri’s Ciarán Nugent examined changes in average public sector hourly earnings using the latest quarterly CSO data.
Those earnings rose from €31.74 in the second quarter of 2021 to €39.31 in the second quarter of 2026 – an increase of approximately 23.9%.
Comparing average consumer prices across the same quarters gives an increase of approximately 24.5%.
On that measure, average hourly earnings were slightly behind inflation; the difference translates into a reduction in purchasing power of approximately 0.5%.
However, this comparison covers Q2 2021 to Q2 2026, rather than the period from 2021 to 2025 stated by Callinan on RTÉ, so it does not establish whether the union leader’s claim that the average public servant was at least 5% behind inflation is correct.
Nugent said the starting and ending dates matter, particularly because negotiated public service increases take effect at specific points; as we mentioned previously, different dates can therefore produce different results.
Were public sector pay increases behind inflation from 2021 to 2025?
Neri economist Ciarán Nugent also stressed that the dates chosen can affect the result.
“If you pick that quarter as your starting point, then you might have a slightly different answer over five years,” he said.
Callinan’s claim specifically referred to the five-year period from 2021 to 2025.
To capture increases throughout those years, we need to take a starting point at the end of 2020, immediately before that period began.
The general percentage increases under Building Momentum and its extension compounded to approximately 8.8% from 2021 to 2023.
The percentage increases that were subsequently introduced under the next pay agreement compounded to approximately 7.5% during 2024 and 2025.
Taken together, these awards therefore increased basic salary rates by approximately 16.9% (once again ignoring minimum cash increases, local bargaining measures, pay restoration and progression through salary scales).
And when an additional 1% sectoral increase is included, as applied in the civil service under Building Momentum, the compounded increase to approximately 18.1%.
Over the corresponding period, CSO Consumer Price Index figures show that prices increased by approximately 24.5%, when comparing December 2020 with December 2025.
For a worker whose salary increased by 18.1%, that represented a reduction in purchasing power of approximately 5.1%.
That figure is calculated by dividing the increase in salary by the increase in prices, rather than simply subtracting the two percentages.
For example, if your pay rises by 18.1%, you have €118.10 for every €100 you previously earned, but goods that cost €100 now cost €124.50; so dividing €118.10 by €124.50 shows your pay buys about 5.1% less – reflecting the actual loss of purchasing power.
That calculation produces a result close to Callinan’s claim.
However, it does not establish the outcome for the average public servant, because workers receiving the minimum cash increases would have benefited from larger proportional rises.
Increments, promotions, restoration and additional negotiated changes could also have affected their earnings, so these salary examples begin after the January 2018 increase; the agreement-wide calculations below include that award did not necessarily translate into an identical salary increase for every public servant.
The separate comparison uses the CSO’s measured average hourly earnings, following the approach discussed by Nugent.
According to the CSO’s earnings dataset, average public sector hourly earnings rose from €31.21 in the final quarter of 2020 to €38.60 in the final quarter of 2025 – an increase of approximately 23.7%.
Average consumer prices across those same quarters increased by approximately 24.5%; on that basis, average hourly earnings fell by approximately 0.7% in real terms.
That comparison therefore shows a considerably smaller shortfall than 5%.
The available calculations therefore provide a possible basis for Callinan’s figure, but do not yet establish his specific claim about the “average public servant”.
The Journal’s FactCheck is a signatory to the International Fact-Checking Network’s Code of Principles. You can read it here. For information on how FactCheck works, what the verdicts mean, and how you can take part, check out our Reader’s Guide here. You can read about the team of editors and reporters who work on the factchecks here.

To embed this post, copy the code below on your site















have your say